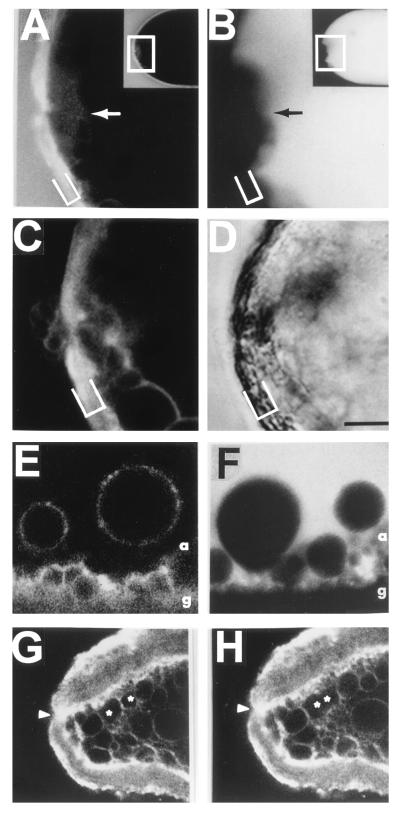
Figure 2.
Confocal fluorescence images of the cut end of an MGA transected in physiological saline with one hydrophilic dye placed extracellularly (A) and another placed intracellularly (B) showing the abrupt inner and outer dye boundaries at vesicular accumulations, vesicles labeled with a membrane-incorporating (10) styryl dye placed extracellularly (C) and the DIC image (D). Brackets mark limits of glial sheath. (A and B) Long-axis midsection fluorescence images both obtained at 90 min posttransection (A) Image of 0.1% Texas Red–dextran added to physiological saline 60 min posttransection. (B) Image of 0.1% FITC–dextran in intracellular saline injected into MGA prior to transection. Higher-magnification images correspond to the respective boxed areas in Insets (lower-magnification images). Arrow in A indicates location of outer dye barrier. Arrow in B indicates location of inner dye barrier. (C) Fluorescence image at 120 min posttransection of an MGA following addition of FM1-43 to the bath at 95 min posttransection. The fluorescence of the FITC–dextran was greatly reduced (photobleached) by prior illumination and was much less than the fluorescence intensity of the FM1-43 which was incorporated into the membranes of the vesicles at the cut end. (D) DIC image taken simultaneously with C. (E and F) Confocal fluorescence images in a transected MGA suggesting that vesicles arise from invaginations of the axolemma by endocytosis. a, Axoplasm; g, glial sheath. (E) Fluorescence image of an MGA after FM1-43 (25 μM) was added to the bath for 5 min and then removed from the bath prior to transecting the MGA. The membranes of many vesicles induced after transection were labeled with the styryl dye in a ring-shaped pattern when imaged in one confocal plane. (F) Fluorescence image of a transected MGA that was injected with 0.1% FITC–dextran in an internal saline solution prior to its transection. When imaged after transection, vesicles which formed after transection did not contain the hydrophilic dye. (G and H) Long-axis confocal fluorescence images taken from a series of time-lapse images of the cut end of an MGA pulse labeled with FM1-43 (25 μM) prior to transection showing a single fusion event of two vesicles, each marked by an asterisk. (G) Prior to fusion. (H) After fusion. Arrowhead marks the small pore at the cut end. (Bar in D = 20 μm for A–D, 85 μm for Insets in A and B, 5 μm for E and F, and 40 μm for G and H.)

