
Fig. 3.
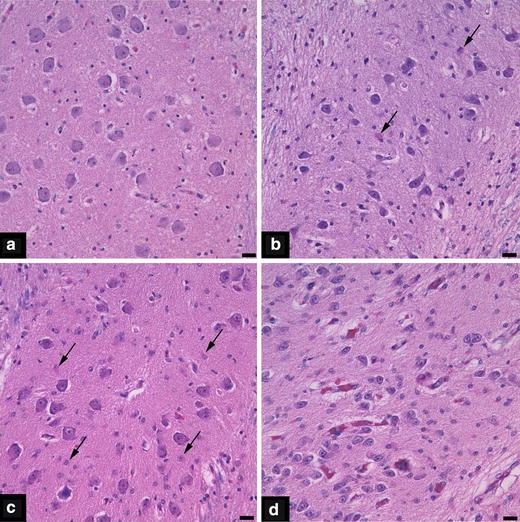
Photomicrographs from the inferior olivary nuclei depicting gliosis scores of 0 (a), 1 (b), 2 (c) and 3 (d). Arrows in panels b and c indicate some of the reactive astrocytes that are present. The scale bar represents 20 μm
Official websites use .gov
A
.gov website belongs to an official
government organization in the United States.
Secure .gov websites use HTTPS
A lock (
) or https:// means you've safely
connected to the .gov website. Share sensitive
information only on official, secure websites.
Photomicrographs from the inferior olivary nuclei depicting gliosis scores of 0 (a), 1 (b), 2 (c) and 3 (d). Arrows in panels b and c indicate some of the reactive astrocytes that are present. The scale bar represents 20 μm