
Fig. 1.
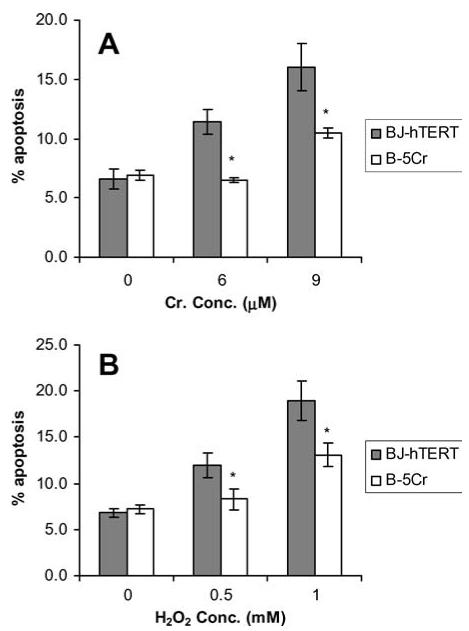
Apoptosis resistance in the B-5Cr survivor sub-population. B-5Cr cells were compared to parental BJ-hTERT cells for susceptibility to apoptosis. Cells received either (A) chronic (6-9 μM; 24 h) treatments of Na2CrO4, or (B) chronic (0.5-1 mM; 24 h) treatments of H2O2, and were analysed for phosphatidylserine translocation 24 h after treatment. The percentages of apoptotic cells represent the mean ± S.E. of at least three independent experiments. Comparisons were made between individual correlated samples compared to control, and p values were determined with a Student’s t-test and a normal distribution was verified with ANOVA and F-test. Asterisk (*) indicates a statistically significant decrease from control at p < 0.05.