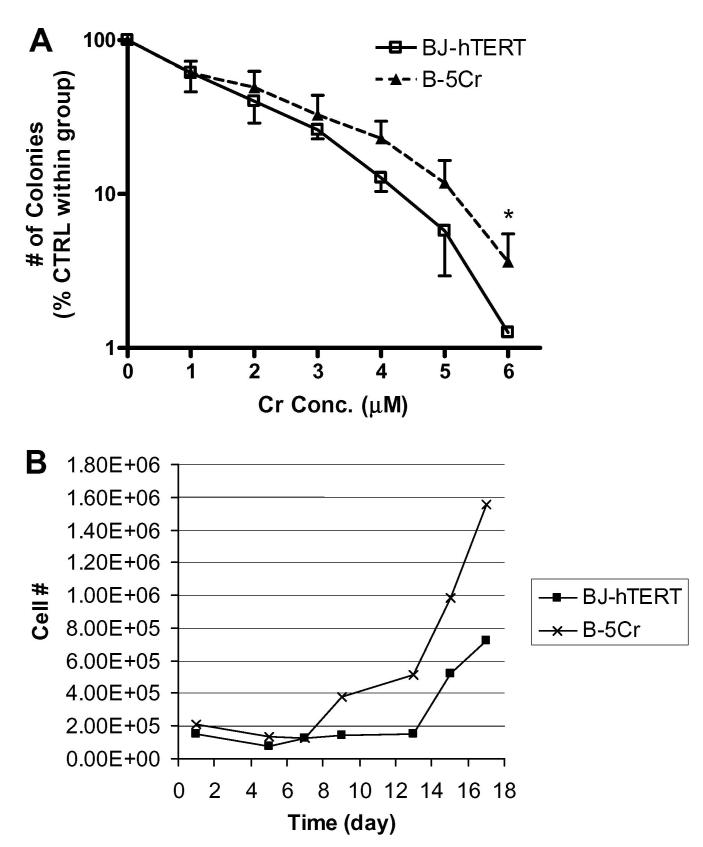
Fig. 2.
Altered clonogenicity and cell growth potential in the B-5Cr survivor sub-population. (A) The cloning efficiency of survivor sub-population (B-5Cr) cells exposed to increasing concentrations of Na2CrO4 (1-6 μM, 24 h) was analysed and compared to BJ-hTERT. The number of colonies counted at the indicated concentrations of Na2CrO4 are expressed as a percentage of the 0 μM control for each group. Results are plotted on a semi-log graph and are the mean of at least three independent experiments. Comparisons were made between individual correlated samples compared to control, and p values were determined with a Student’s t-test and a normal distribution was verified with ANOVA and F-test. Asterisk (*) indicates a statistically significant increase from parental control at p < 0.05. (B) Growth curves were plotted for B-5Cr and BJ-hTERT cells after exposure to 5 μM Na2CrO4 for 24 h. Na2CrO4 was added to the dishes at day 0 and removed after 24 h. Total cell number was plotted over a 17-day period and indicates sample population cell loss, and sample population growth recovery throughout the time course for each cell population. Results are one representative experiment.

