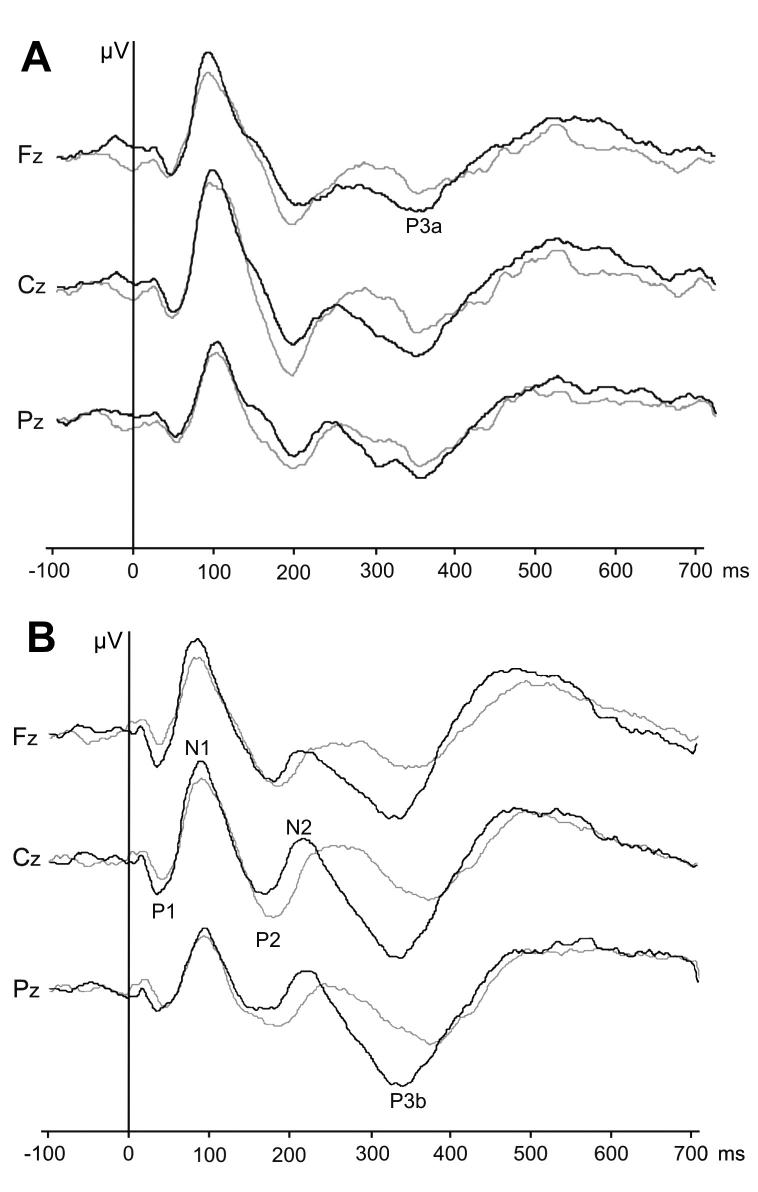
Figure 1.
Grand-averaged event-related potentials for patients after subarachnoid hemorrhage (gray line) and controls (black line) for non-target (A) and target (B) stimuli. The abscise shows time (ms) from the onset of stimuli; ordinate shows voltage (1 mm = 0.5 μV) in the three bands according to the baseline (at time 0 ms the voltage is 0 μV in each band).

