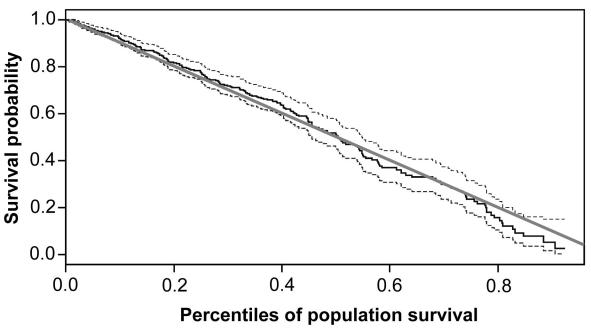
Figure 3.
Comparison by the transformation approach (16) of the observed survival in the Metlika cohort (subjects with and without peripheral arterial disease taken together). Gray line – survival of the Slovene population in the same calendar period; full line – the cohort; dashed lines – 95% confidence intervals for the observed survival in the cohort.

