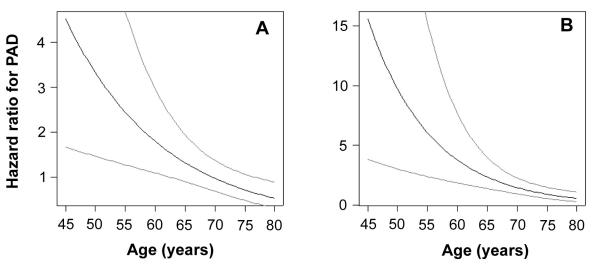
Figure 5.
The risk of dying in the next 15 years in the presence of peripheral arterial disease (PAD) in comparison with risk of an age-matched and other risk factor-matched person with normal ankle-brachial pressure index, as a function of age at inclusion. The hazard ratios (full line) for all-cause mortality (A) and cardiovascular mortality (B) are shown with 95% confidence intervals (dashed lines).

