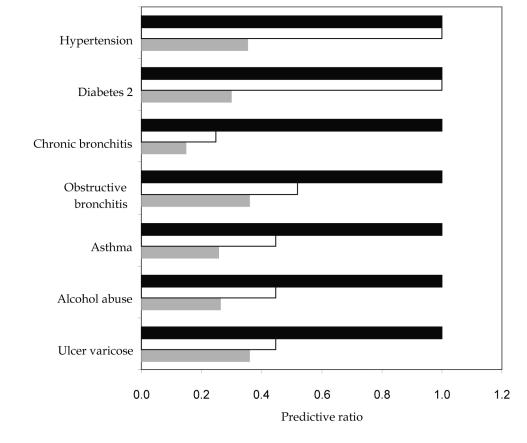
Figure 3.
Predictive ratios for selected diagnostic groups under three models (sex and age; sex, age, and two diagnoses; and sex, age, and seven diagnoses) calculated on a sample of N = 10 000. A ratio of 1.0 indicates accurate prediction, less than 1.0 under-prediction, and more than 1.0 over- prediction. Closed bars – model including sex, age, hypertension (ICD-10 I10), diabetes mellitus 2 (ICD-10 E11), obstructive bronchitis syndrome (ICD-10 J44), chronic bronchitis (ICD-10 J41-J42), asthma (ICD-10 J45), alcohol abuse (ICD-10 F10), varicose veins with ulcer (ICD-10 I83); open bars – model including sex, age, and two diseases, hypertension and diabetes; gray bars – sex and age model; ICD-10 – International Statistical Classification of Diseases and Related Health Problems, 10th revision (20).

