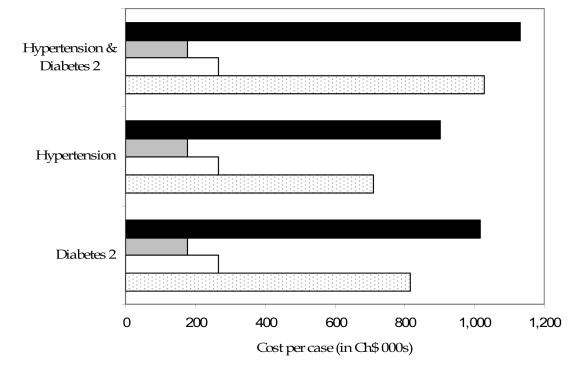
Figure 4.
Actual per capita expenditures compared with current per capita payments and predicted model per capita values (CLP) calculated on a sample of N = 10 000. CLP – Chilean pesos (US$1 = CLP540 in 2000). Closed bars – actual expenditures per case; gray bars – current payments per capita by the Ministry of Health; open bars – predicted per capita values from sex and age model; dotted bars – predicted values from sex age and hypertension (ICD-10 I10) and diabetes mellitus type 2 (ICD-10 E11) model; ICD-10 – International Statistical Classification of Diseases and Related Health Problems, 10th revision (20).

