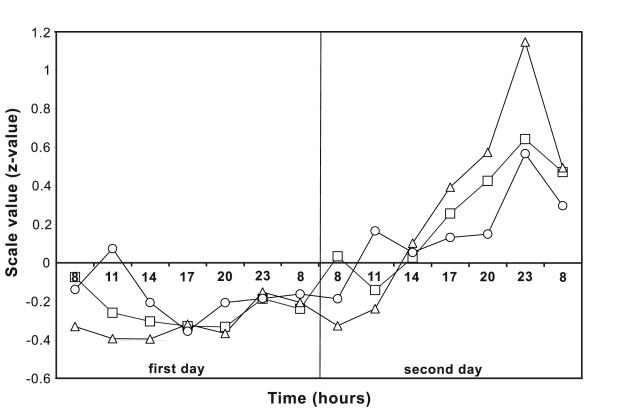
Figure 1.
The results of testing (z-values) of mental and psychomotor performance on CRD-series during the first (free hydration) and the second (voluntary 24-hour fluid intake deprivation) day of the experiment (n = 10). Squares – total test solving time; triangles – minimum single task solving time; circles – total ballast (“lost” time, a sum of differences between minimum single task solving time and each of all other single task solving times).

