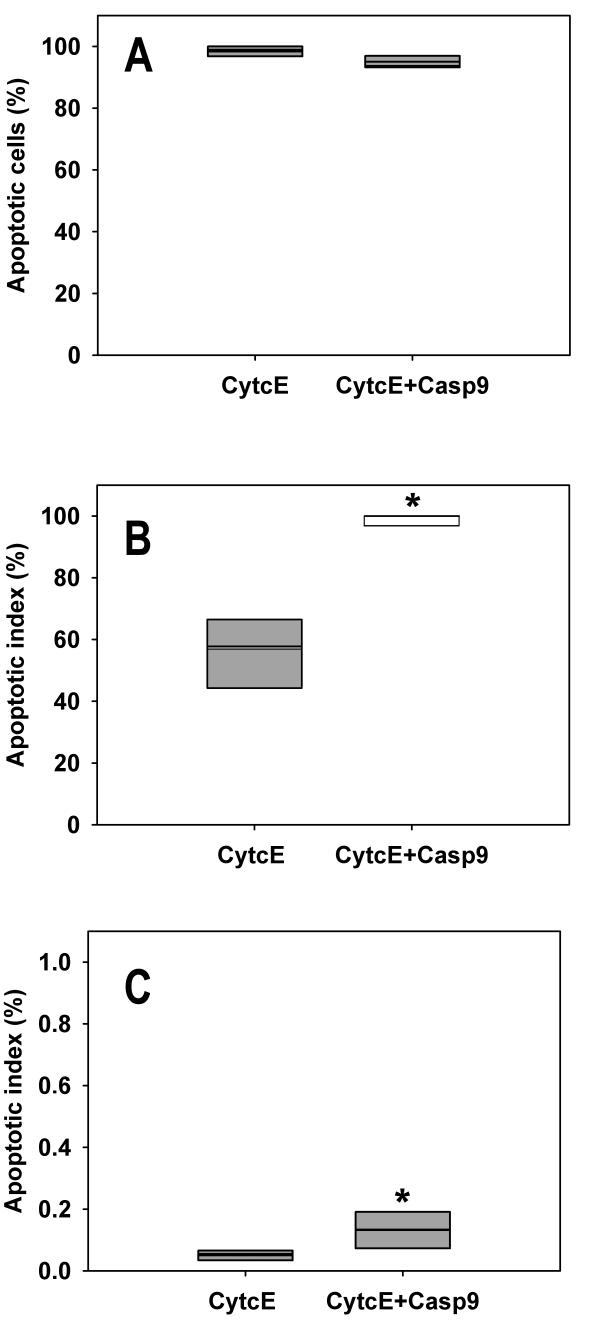
Figure 2.
Overexpression of caspase-9 triggers apoptosis in pituitary cells. (A) The percentage of apoptotic cells among all dead cells. There is a statistically significant difference between the cells overexpressing CytcE and CytcE+Casp9 from five independent experiments (P<0.001, Fisher exact test). Because the magnitude of the difference is very small, we do not consider it practically significant. (CytcE: cytochrome c-EGFP, CytcE+Casp9: cytochrome c-EGFP and caspase-9). The thin line indicates the mean value. (B) Apoptotic index (AI) of cells overexpressing the fluorescent fusion proteins. AI was calculated as the ratio of the numbers of annexin labeled fluorescent cells and all fluorescent cells. The addition of caspase-9 to CytcE significantly increases AI from 58% to 100% (medians; P<0.001 Fisher exact test). The thin line indicates the mean value. (C) Apoptotic index of control cells, compared with those overexpressing the fluorescent fusion proteins. The non-fluorescent cells were grown on the same coverslips as the fluorescent ones; however, they were not overexpressing the fluorescent proteins. Although nonfluorescent cells predominated, the apoptotic index was more than 100-fold lower than in the case of their fluorescent counterparts. There is a statistically significant difference between CytcE and CytcE+Casp9 (P<0.001, Fisher exact test). Because of the small size of the difference, we do not consider that the calculated statistical difference is practically significant. The thin line indicates the mean value.

