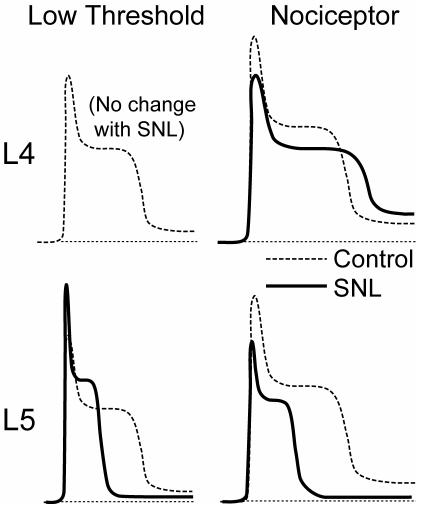
Figure 11.
Schematic traces of Ca2+ transients indicated by fluorescence ratio of Fura-2 (R340/380), summarizing injury-induced alterations. The bottom two panels show traces for axotomized neurons from the 5th lumbar (L5) ganglion after spinal nerve ligation, while the upper two panels show traces for neighboring neurons from the L4 ganglion. For both, the left panels show traces from large and capsaicin-insensitive neurons that convey non-nociceptive sensory information, while the right panels show traces from small and capsaicin-sensitive nociceptive neurons. In each case, the dotted line represents traces from control neurons and the solid line represents traces from neurons after injury.

