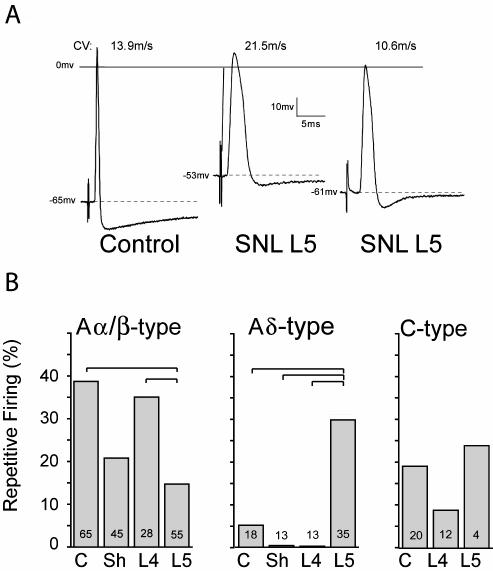
Figure 5.
Action potential (AP) dimensions in control neurons and after spinal nerve ligation (SNL), by intracellular microelectrode recording from intact dorsal root ganglia. (A) Three sample recordings from control and from the fifth lumber (L5) ganglion after SNL show the loss of afterhyperpolarization and increase in AP duration after injury. CV – conduction velocity. Resting membrane potential is indicated by the dotted lines. (B) Average data for the incidence of repetitive firing during sustained depolarization of neurons in the control group (C), after sham injury (Sh), and in the L4 and L5 ganglia after SNL. Small numbers in the columns indicate number of neurons recorded. Brackets indicate significant differences by post hoc testing. From Sapunar et al (59), with permission.

