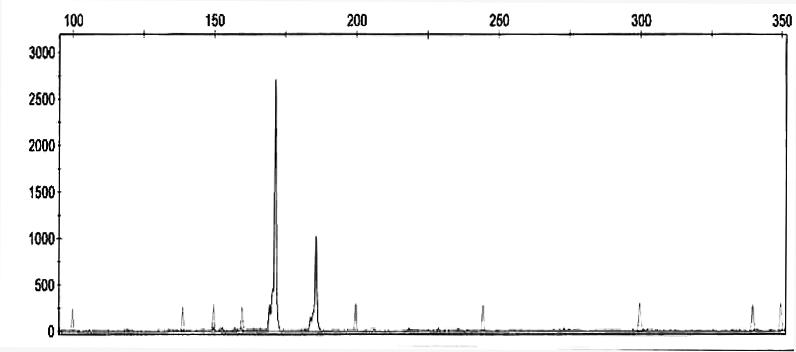
Figure 2.

The electropherogram of olive DNA obtained in this study by applying UDO99-024 microsatellite-based marker (internal size standard – LIZ 500). X-axis indicates fragment lenght (bp), while Y-axis indicates relative flourescent units (RFU) that are proportional to the amount of PCR product.
