
Figure 6.

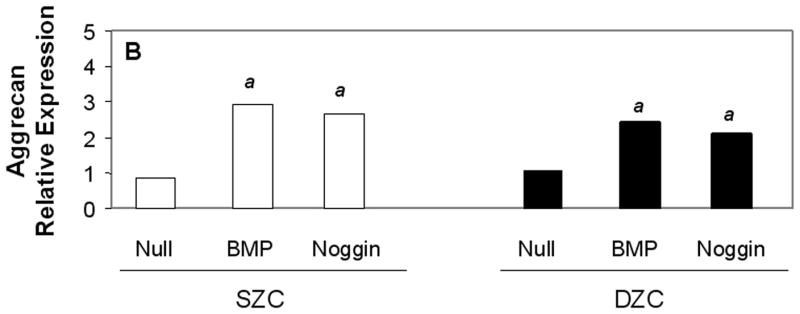
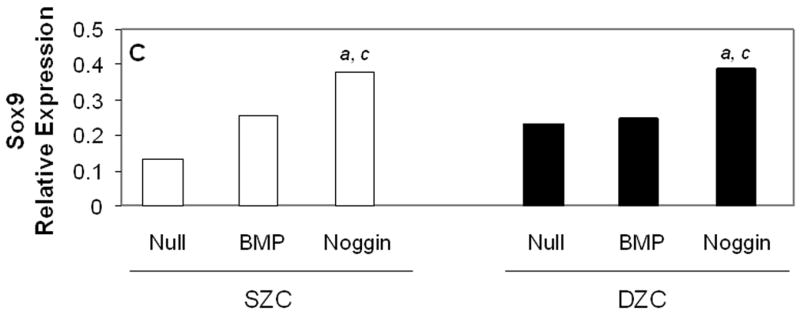
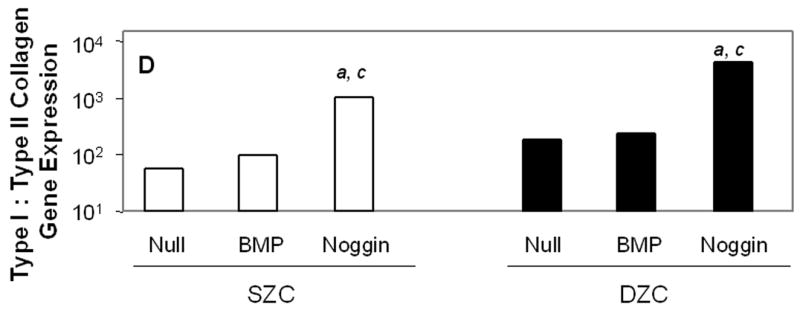
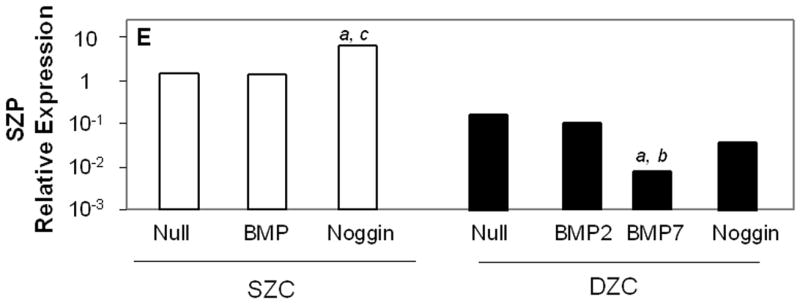
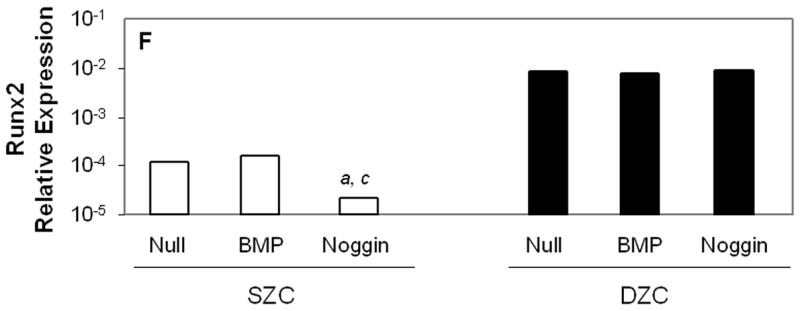
Gene expression patterns in SZC and DZC treated with Ad vectors encoding no transgene (Null), BMP2 or -7 (BMP) or Noggin. Levels of expression of (A) type II collagen, (B) aggrecan, (C) Sox9, (D) ratio of type II collagen:type I collagen gene expression, as well as expression levels of (E) superficial zone protein [SZP] and (F) Runx2 were measured after 7 days of culture by qRT-PCR and normalized to the expression level of β-actin gene as described in Experimental Procedures. White bars represent SZC and black bars represent DZC. Where differences were not found for BMP2 and BMP7 overexpressing cells, data were pooled and are represented as ‘BMP’. Each bar represents mean relative expression levels for 3 – 6 samples per group per time point. [a], [b] and [c] indicate statistical significance with p<0.02 compared to control, Noggin or BMP, respectively. Error bars are not included as statistical significance was tested on ∆CT values based on which relative expression was calculated.