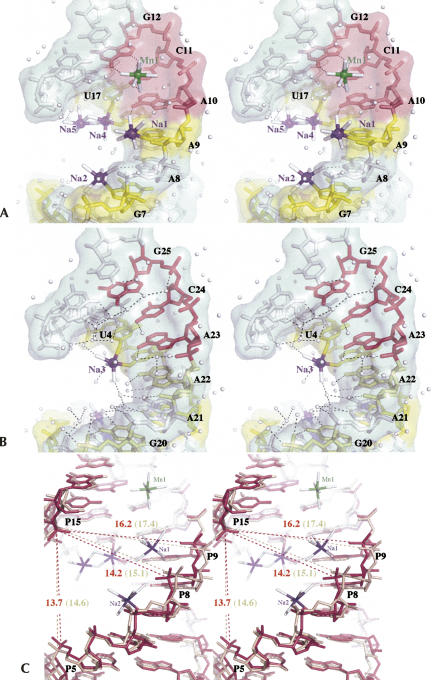
FIGURE 4.
Ion binding sites in the Br1 tridecamer. (A) Ionophilic half (G7–C13). (B) Hydrophilic half (G20–C26) (C) Superimposition of the ionophilic half (dark pink) and the hydrophilic half (gold). The distances between the phosphorus atoms are reported in ångstroms. Distances between the corresponding phosphorus atoms of the hydrophilic half are depicted in parentheses.

