
FIGURE 4. Receptor activation by FGFs 19, 21, and 23.
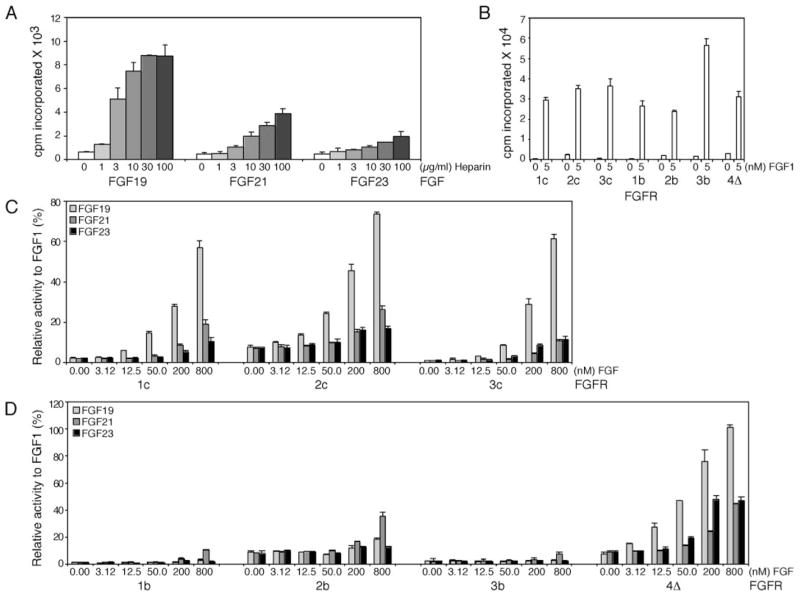
A, heparin dose response for FGFs 19, 21, and 23 measured on FGFR1c-expressing BaF3 cells. Activity increases with increasing heparin but appears to plateau at concentrations >10 μg/ml. B, FGF1 control activity used to normalize the activity of FGFs 19, 21, and 23. C, BaF3 cell mitogenic assay for c-spliced FGFRs. D, BaF3 cell mitogenic assay for b-spliced FGFRs and FGFR4Δ.