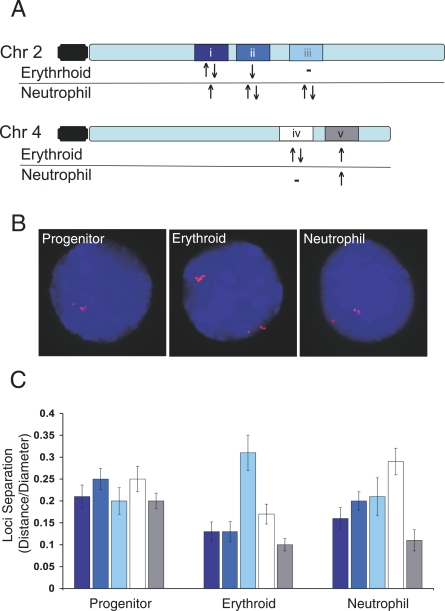
Figure 5. Gene Domains Exhibit Differential Nuclear Proximity According to Their Co-Regulation.
(A) Five chromosome domains (i–v) on two chromosomes were identified with genes co-regulated during differentiation of the progenitors to erythroid and neutrophil lineages (Dataset S1). The domains are composed of genes with shared activation (upward-pointing arrow), silencing (downward-pointing arrow), mixed (upward- followed by downward-pointing arrows), or no co-regulated genes (minus sign). They range from ∼13 to 2 Mbp and are represented by FISH probes generated with multiple bacterial artificial chromosomes (BACs) for each domain.
(B) FISH images of nuclei from the three lineages (counterstained with DAPI) hybridized with six BAC probes (red) to domain iii (∼6 Mbp).
(C) Bar graph of results for each probe set (i–v) hybridized to nuclei from each lineage. Masks of the FISH signals were generated and the nearest distance between the masks was measured. Distances are expressed as a ratio of the nuclear diameter. At least 30 nuclei from each lineage for each probe set were analyzed; lines represent standard error of the mean.

