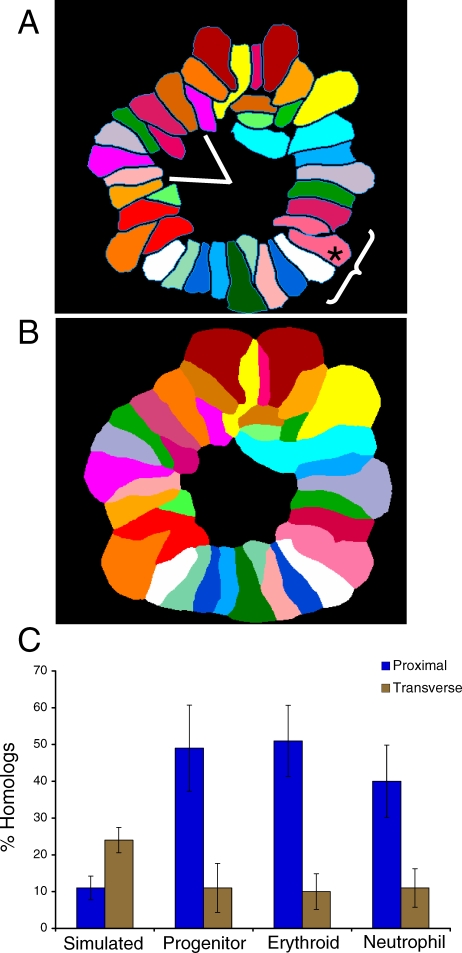
Figure 6. Total Chromosome Analysis Supports the Prevalence of Homolog Proximity.
We studied chromosome organization by simultaneously detecting all of the chromosomes in lineage-specific rosettes using SKY. (A) We performed two types of analyses on at least 30 rosettes from each cell type and a simulated rosette dataset (Materials and Methods): (1) homologous sister chromatid pairs (homologous chromosomes) were assayed for proximity by determining the frequency of their being within two chromosomes of each other (asterisks indicates the assayed chromosome, the bracket identifies the region of proximity as three chromosomes on either side); (2) homologous chromosomes were scored for being transverse by determining their frequency of being across the centre of a rosette in a 60° angle window (encompassing ∼8 chromosomes). Chromosomes X and Y are not considered homologous and are not a part of this analysis.
(B) Illustration of the distance constrained zone-of-influence (ZOI) operation performed by SVCell. The proximity of CTs is calculated automatically by performing a ZOI-based region partition around each CT. The ZOI operation creates an unambiguous representation across which adjacency transitions can be determined. If at least one pixel of two chromosomes' partitioned regions touch, then they are considered proximal.
(C) Spatial pattern rules were created in SVCell and used to measure proximal and transverse associations for all chromosomes in each of the rosettes for the three lineages and the simulated dataset. The bar graph depicts these results as a mean of the chromosomal data for each lineage (for individual chromosome data, see Figure S9A and S9B); lines indicate standard deviation.

