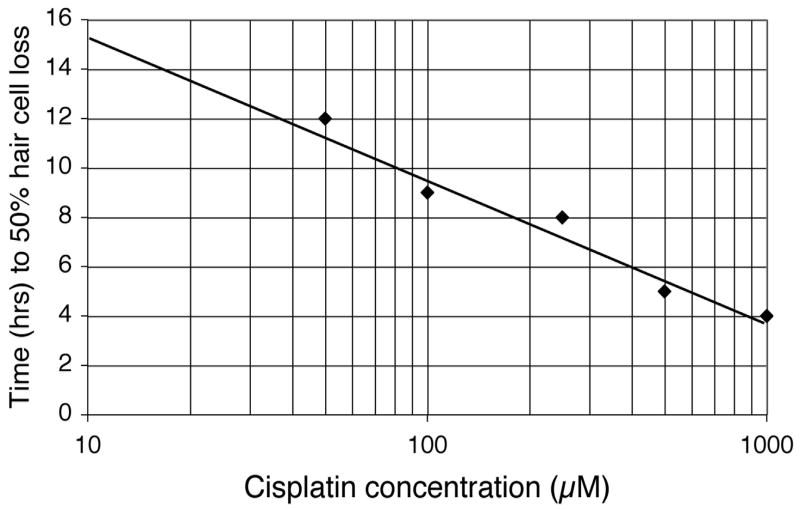
Figure 6.
Linear regression of time required to achieve 50% hair cell loss as a function of cisplatin concentration (t1/2). Cisplatin concentration is plotted on a logarithmic scale. Data points were calculated from linear regression functions from Table 1. Regression line depicted is represented by the formula t1/2 = −5.5log(μM cisplatin) + 20 (r2 =0.97).

