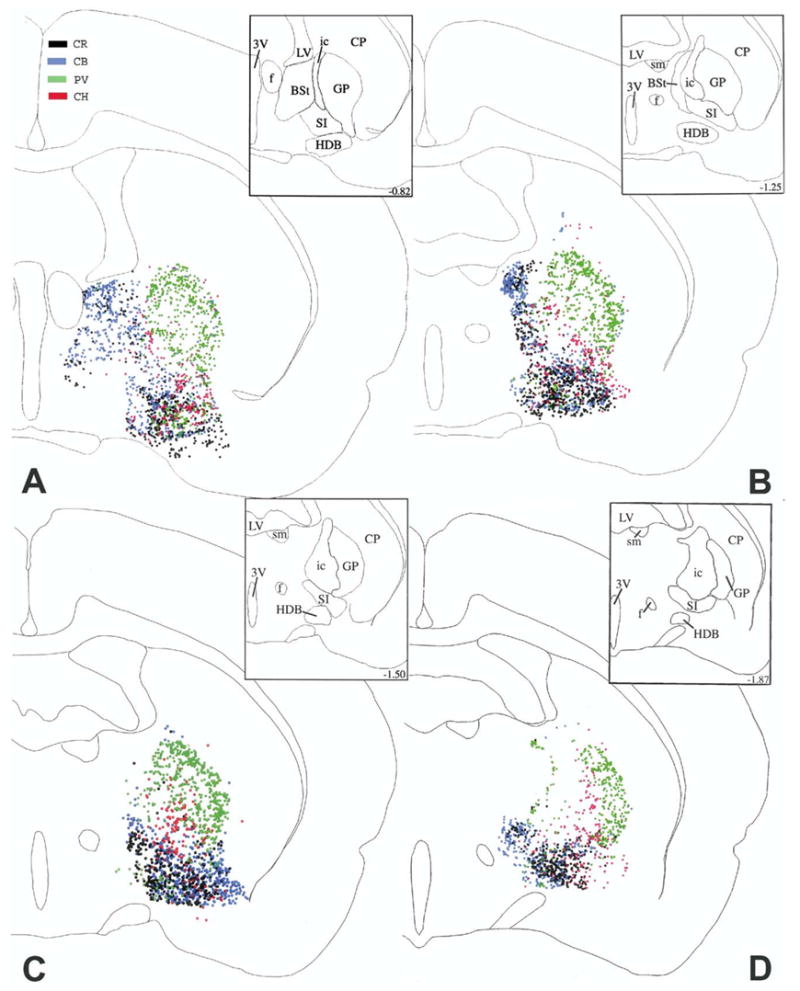
Fig. 2.

The distribution of cholinergic (CH, red), PV (green), CR (black) and CB (blue) cells at four caudal levels from the right side of brain #96001. These maps were generated by superimposing the original Neurolucida® maps plotted from sets of four sections alternately stained for CH, PV, CR, and CB, using landmarks and alignment techniques. Upper right insets show the outlines of individual basal forebrain areas applied in this study. Numbers in the insets represent distances in mm from the bregma, based upon the atlas of Paxinos and Watson (1986, 2005).
