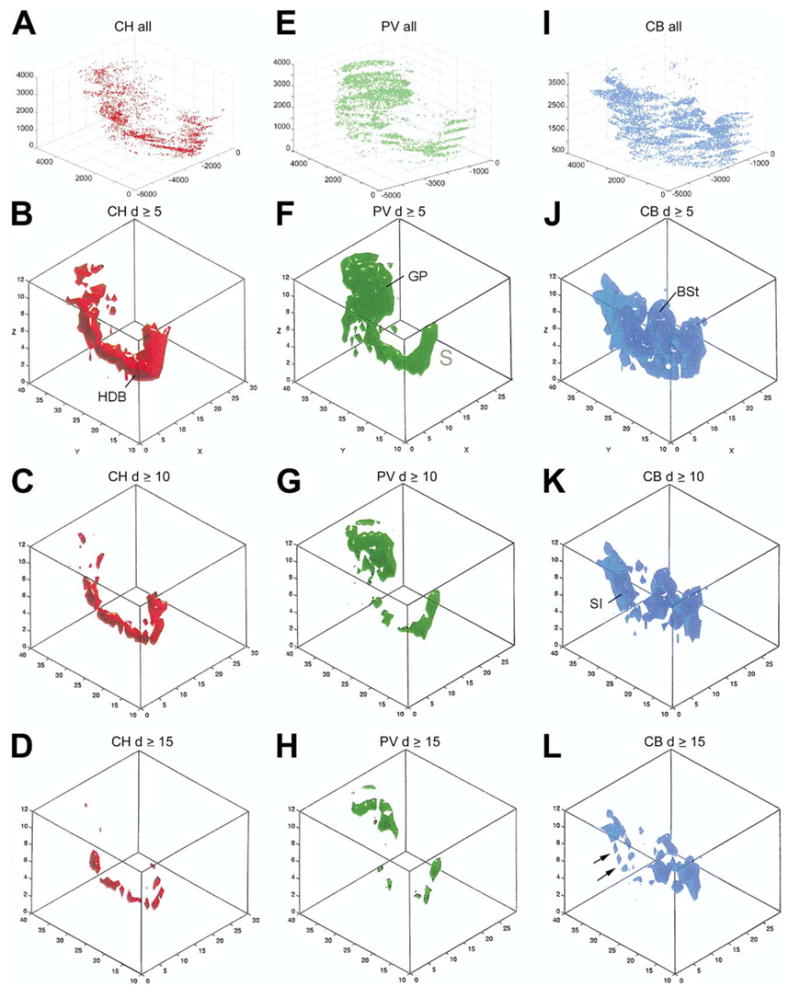
Fig. 3.

(A, E, I) Spatial distribution of all cholinergic (CH, red), PV (green) and CB (blue) cells from the right side of case #96001 as shown in separate coordinate systems. The numbers along the axes represent distances in micron of a given point from the reference point as traced in the Neurolucida® system. Flakes are due to the section steps along the z axis. B, C, D cholinergic; F, G, H PV and J, K, L CB iso-density surfaces. Threshold density: 5 ≥ (B, F, J), 10 ≥ (C,G, K) 15 ≥ (D, H, L) cells per unit space (250 × 250 × 50 μm). The numbers in the box plots represent voxel indices along the x and y axis. Numbers along the z axis are the layers. x-Axis: medio-lateral, y-axis: antero-posterior, z-axis: rostro-caudal.
