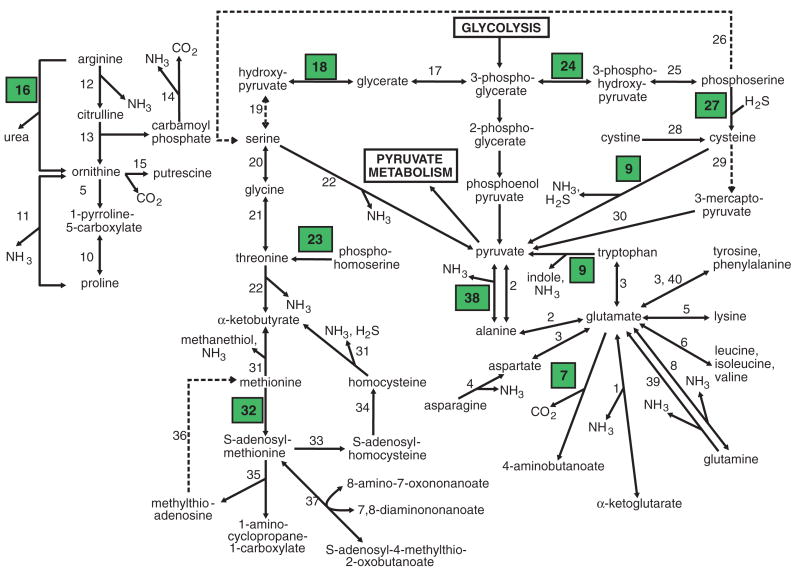
Fig. 2.
Schematic of T. vaginalis amino acid metabolism. A complete description of enzymatic reactions (represented as numbers) is given in the SOM text. Broken lines represent enzymes for which no gene was identified in the genome sequence, although the activity would appear to be required. Green boxes indicate enzymes encoded by candidate LGT genes.

