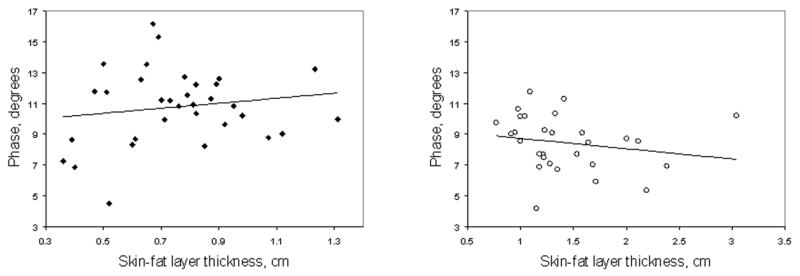
Figure 2.

(a) Scatter plot and linear regression of θ vs. SFL thickness in men. No clear correlation was found between θ and SFL thickness (r2 = 0.02, p = 0.39). A second-degree polynomial fit (not shown) was also generated, for which the r2 value was 0.13 (p = 0.13). (b) Scatter plot and linear regression of θ vs. SFL thickness in women. Similar to the men, no clear correlation was found between θ and SFL thickness using linear or (r2 = 0.04, p = 0.32) or quadratic (r2 = 0.18, p = 0.08) fits.
