
Figure 8. Quantification of αSMA cells around dorsal aortae at e9.5 and e10.5.
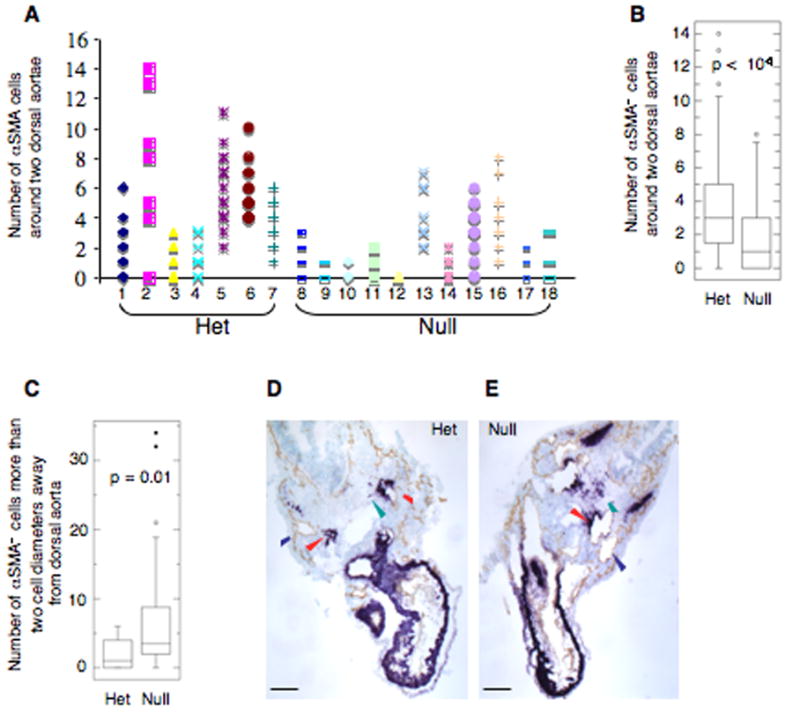
αSMA cells around each of the two dorsal aortae were enumerated.
A. 97 serial sections from seven heterozygous embryos representing four different litters and 126 serial sections from eleven double-null embryos representing five different litters were examined. The numbers of αSMA cells per section around the two dorsal aortae are plotted. Individual embryos are presented along the abscissa. Embryo number 10 was anemic.
B. Summary of the results in A presented as a box plot (the box contains the middle 50% of the data, the horizontal line within the box is the median, points outside of the whiskers (10–90% of data) are outliers).
C. Delay in recruitment of αSMA cells to dorsal aortae in embryos at e10.5 dpc. Three out of five closely examined, morphologically defective double-null embryos representing three different litters had a defect in recruitment of αSMA+ cells to dorsal aortae.
D, E. Transverse sections through a Heterozygous and a double-null embryo stained with antibodies to Pecam-1 and αSMA show excess of αSMA+ cells outside of the immediate proximity of the dorsal aortae. Blue and red arrowheads point to veins and arteries respectively, green arrowhead points to αSMA+ cells. Scale bars are 130 μm.