
Figure 1. Schematic representation of the array tomography method.
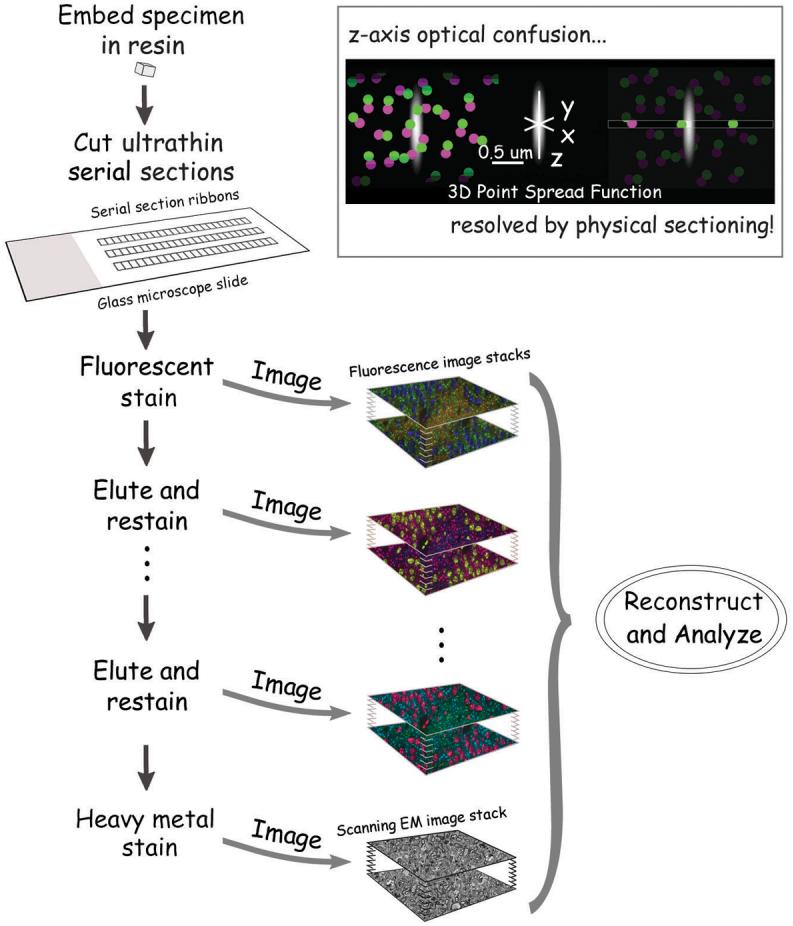
A tissue specimen is embedded in acrylic resin and cut into ribbons of serial ultrathin (50-200 nm) sections, which are then bonded to glass slides. The resulting array is labeled with fluorescent antibodies or other fluorescent stains and imaged to generate ultra-high-resolution volumetric images. The array can be repeatedly eluted, restained and fluorescently imaged, and finally, it can also be stained with heavy metals and imaged under a scanning electron microscope.
Insert illustrates the principle behind the axial resolution enhancement by array tomography. Optical microscopes have their poorest resolution along the optical axis, represented in the figure by z-axis elongation of the 3-D point spread function. Optical sectioning (left) yields an image that is severely degraded by confusion along the z-axis, a problem avoided in array tomography by using ultrathin physical sectioning.