
Figure 8. Results from an automated procedure for the collection of large array tomographic volume images.
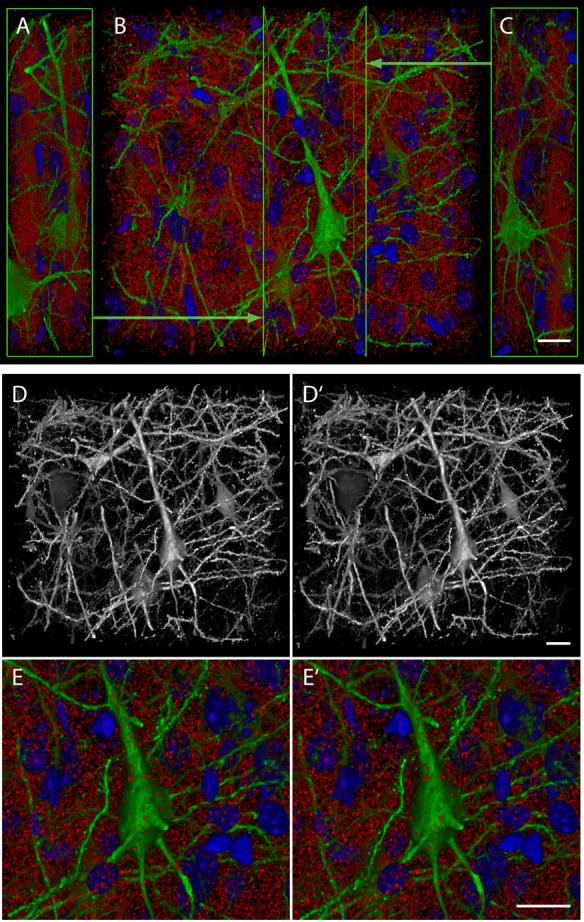
(A -C) Volume renderings from an array tomograph of YFP-H-transgenic mouse cerebral cortex, collected by automated fluorescence microscopy. Tomographic images were acquired in three fluorescence channels (DAPI-DNA, blue; FITC anti-GFP, green; rhodamine anti-synapsin I, red) from 134 sections, each 200 nm thick, using a motorized microscope, a CCD camera and software with image-based automatic focus capability. (B) is a projection along the acquisition Z axis and (A) and (C) are oppositely directed projections along the acquisition X axis, clipped at the Y-Z planes indicated by the bright green lines and arrows in (B). (D) and (D’) are a stereo pair representing solely GFP-channel fluorescence in the same volume as (A-C). (E) and (E’) are a stereo pair of the same volume representing all three fluorescence channels at higher magnification. The very numerous red puncta evident in (A-C) and (E) are consistent with identification as individual presynaptic boutons, while the total density of neural cells within this tissue volume is indicated by the abundant DAPI -stained nuclei evident in these panels. Scale bars, 10 μm.