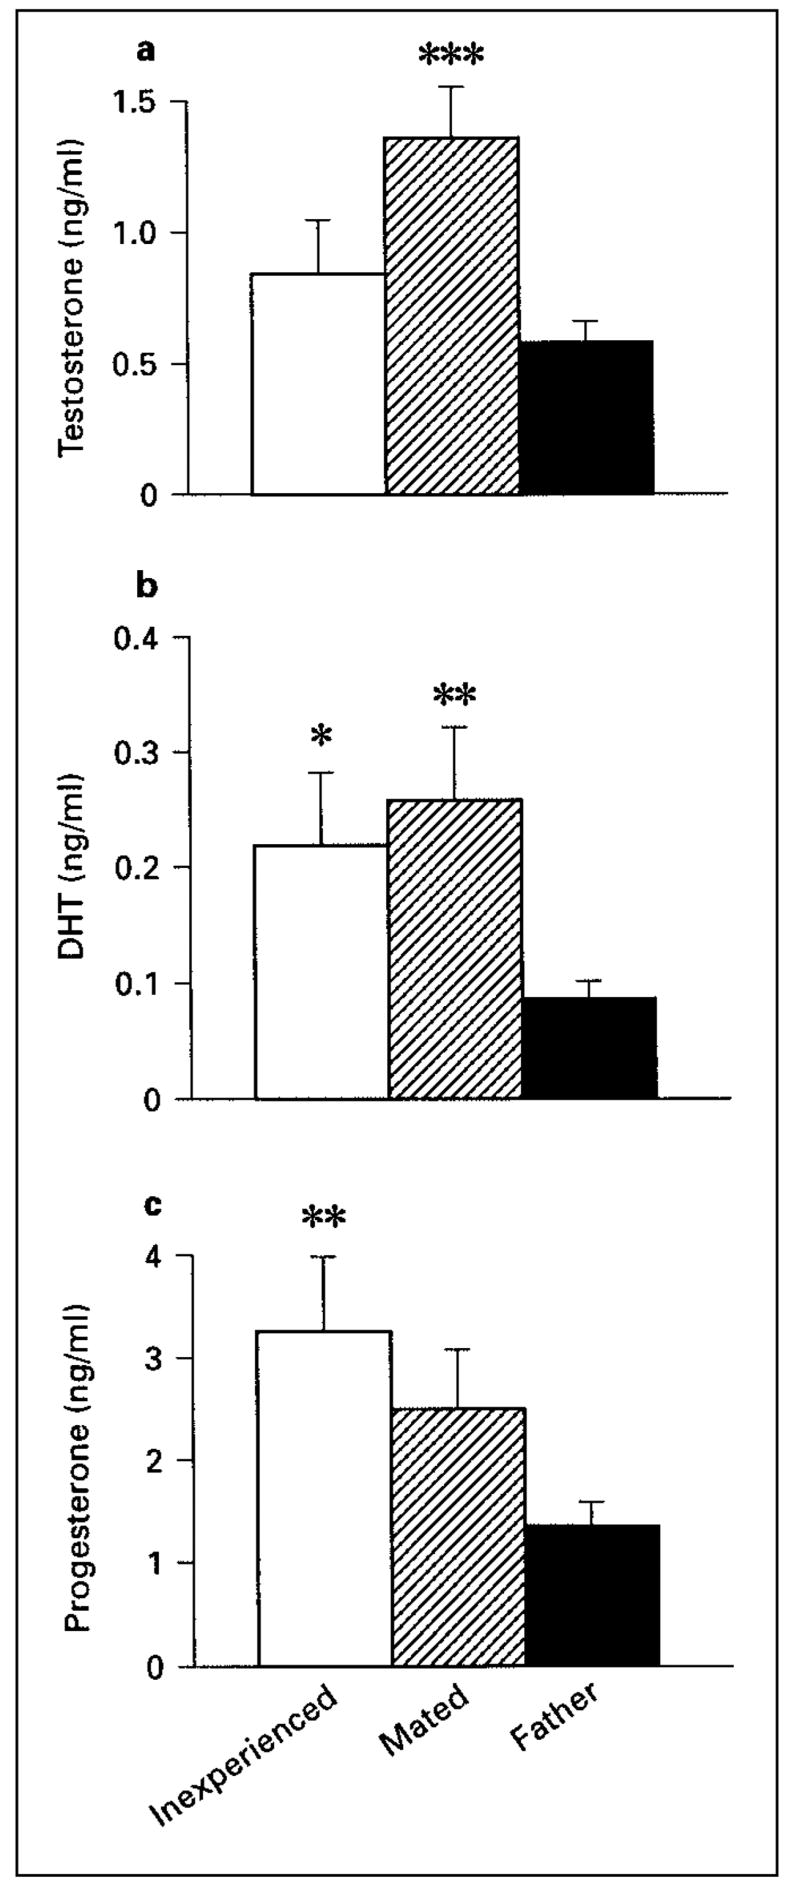
Fig. 3.

Testosterone (a), dihydrotestosterone (b), and progesterone (c) levels for male California mice. *** p = 0.001 from fathers; ** p = 0.01 from fathers. □= Sexually inexperienced males (n = 13); ▨= mated males (n = 11); ■= fathers (n = 15); * p = 0.045 from fathers.
