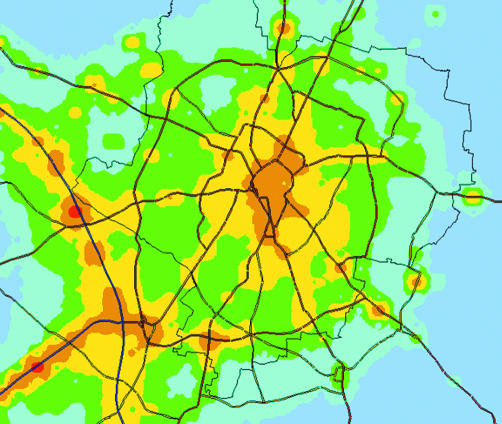
Figure 1 Map of annual mean total PM10 for Leicester calculated using the Airviro dispersion model. The spectrum ranges from blue (low) to green, yellow, orange and red (high). These spatial differences are due to differences in locally generated primary PM10. Areas of high exposure and heavily used roads. © Crown copyright Ordnance Survey, all rights reserved (NC/01/504).

An official website of the United States government
Here's how you know
Official websites use .gov
A
.gov website belongs to an official
government organization in the United States.
Secure .gov websites use HTTPS
A lock (
) or https:// means you've safely
connected to the .gov website. Share sensitive
information only on official, secure websites.
