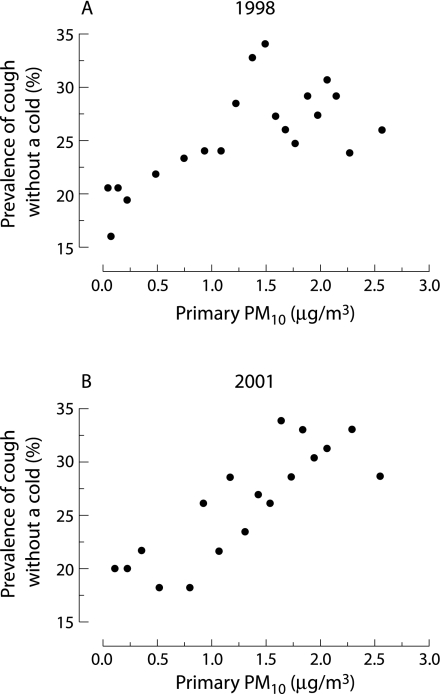
Figure 2 Scatterplots of the relationship between annual exposure to locally generated PM10 at the home address expressed as μg/m3 and prevalence of cough without a cold surveys undertaken in (A) 1998 and (B) 2001 of a random stratified sample of 1–5 year old children in Leicestershire, UK. Each data point represents five centiles of unadjusted data sorted by exposure (n = 128 in 1998 and n = 115 in 2001).

An official website of the United States government
Here's how you know
Official websites use .gov
A
.gov website belongs to an official
government organization in the United States.
Secure .gov websites use HTTPS
A lock (
) or https:// means you've safely
connected to the .gov website. Share sensitive
information only on official, secure websites.
