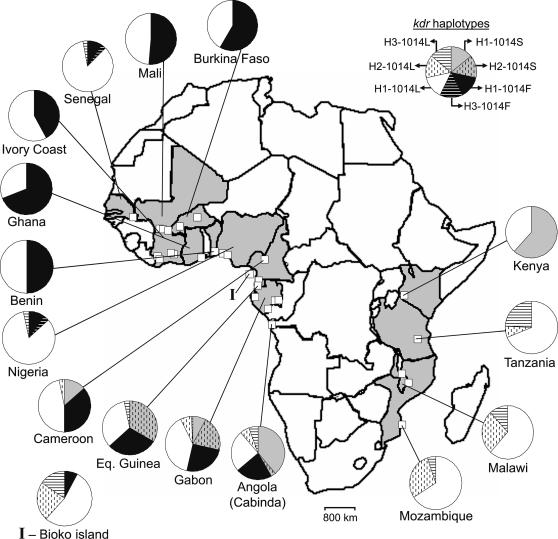
Figure 1. Geographic distribution of kdr alleles and most common intron-1 haplotypes of A. gambiae.
Gray-shaded countries are those included in the study. White squares in the map are the approximate locations of collection sites. Pie charts show the relative frequencies of kdr haplotypes (i.e. kdr alleles and corresponding intron-1 haplotypes), per country. Labels for each kdr haplotype are shown in the example pie chart, at the upper-left corner of the figure.

