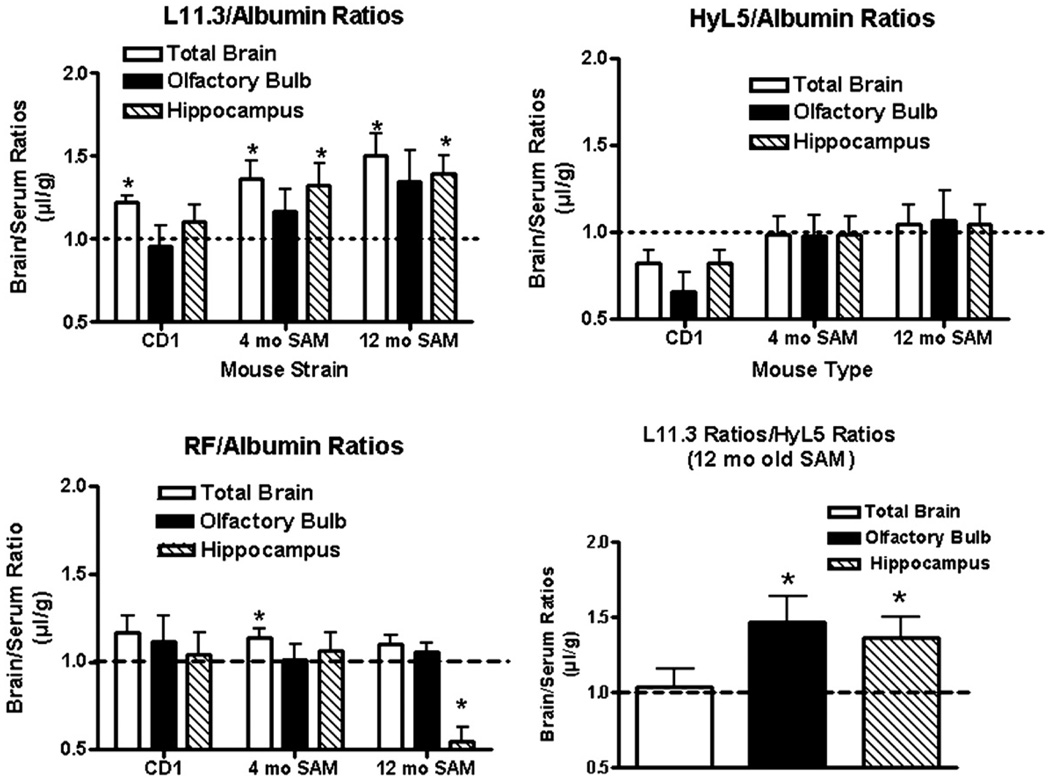
Figure 3.

Comparison of antibodies and albumin. The brain/serum ratios for L11.3 (upper left panel), HyL5 (upper right panel), and control IgM antibody RF (lower left panel) were divided by the brain/serum ratios for simultaneously injected albumin. The lower right panel shows the brain/serum ratios for L11.3 divided by the brain/serum ratios for simultaneously injected HyL5. Data were collected 2h after the simultaneous iv injection of an antibody and albumin so that a ratio of greater than 1.0 indicates an uptake in excess of that for albumin. *indicates value different from the theoretical value of 1.0 at p<0.05 level.
