
Figure 2. RNA electropherograms to assess RNA quality according to treatment conditions.
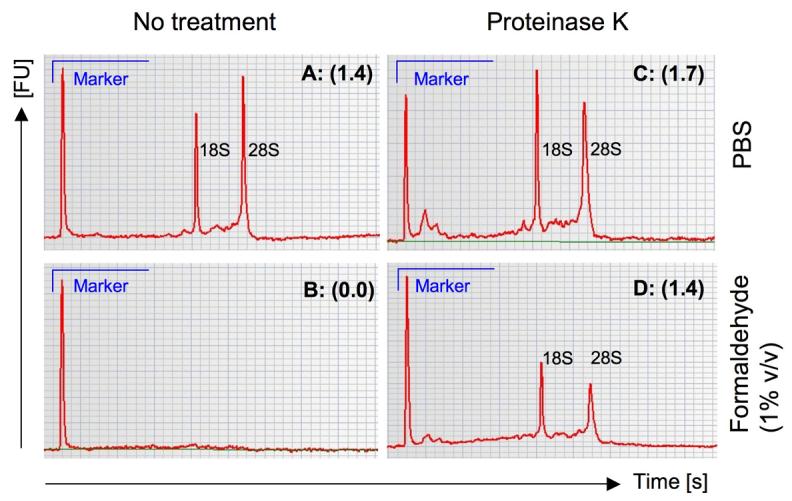
Measurements of 28S:18S ratio (brackets) were calculated based on the area under the curve, detected as fluorescence units [FU] over time in seconds [s] for individual peaks. Whole PBMC fractions without pre-treatment are shown for both unfixed (A) and fixed (B) conditions. Identical sample treatments using proteinase K pre-treatment were compared for PBS in (C) and buffered formaldehyde in (D).