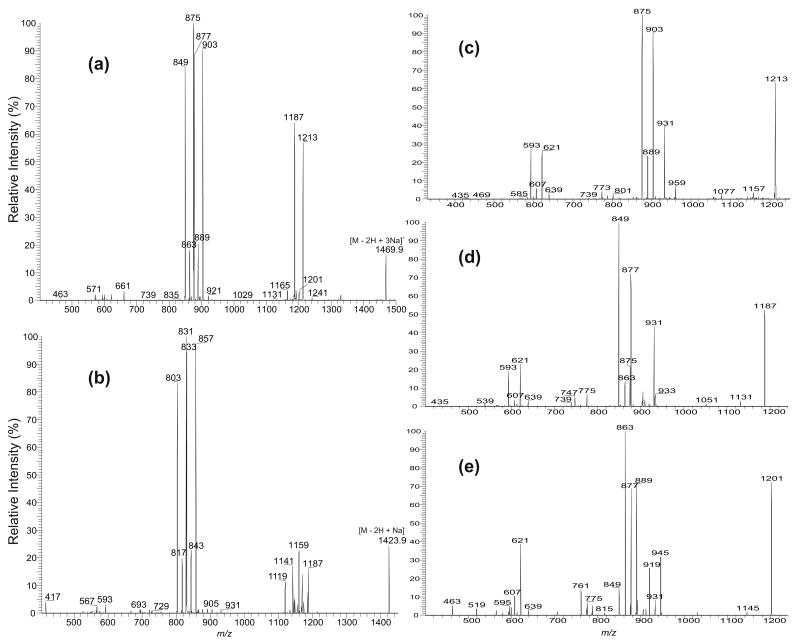
Figure 6.
The IT MS2-spectra of (a) the [M − 2H + 3Na]+ ion at m/z 1469.9 and (b) the [M − 2H + Na]− ion at m/z 1423.9. The consecutive fragmentations are shown in the MS3-spectra of (c) the m/z 1213 ion (1469 →1213), (d) the m/z 1187 ion (1469 → 1187), and (e) of the m/z 1201 ion (1469 → 1201). The m/z 1469 ion (a) consists of two major (18:1/16:1)(16:0/18:1)-CL (from 875/877 pair) and (18:1/18:1)(16:0/16:1)-CL (from 903/849 pair) species, along with the minor (18:1/17:1)(16:0/17:1)-CL and (17:1/17:1) (16:0/18:1)-CL species (from 889/863 pair), consistent with those observed in (b), in which the analogous ion pairs are also seen. Only the major structure in each pair is shown. For example, the m/z 889 ion consists of a major 18:1/17:1- and minor 19:1/16:1-structures and the m/z 849 ion consists of a major 16:0/16:1- and a minor 14:0/18:1-structures, but only the (18:1/17:1)(16:0/17:1)-CL and (18:1/18:1)(16:0/16:1)-CL structures are described.

