
Figure 5.
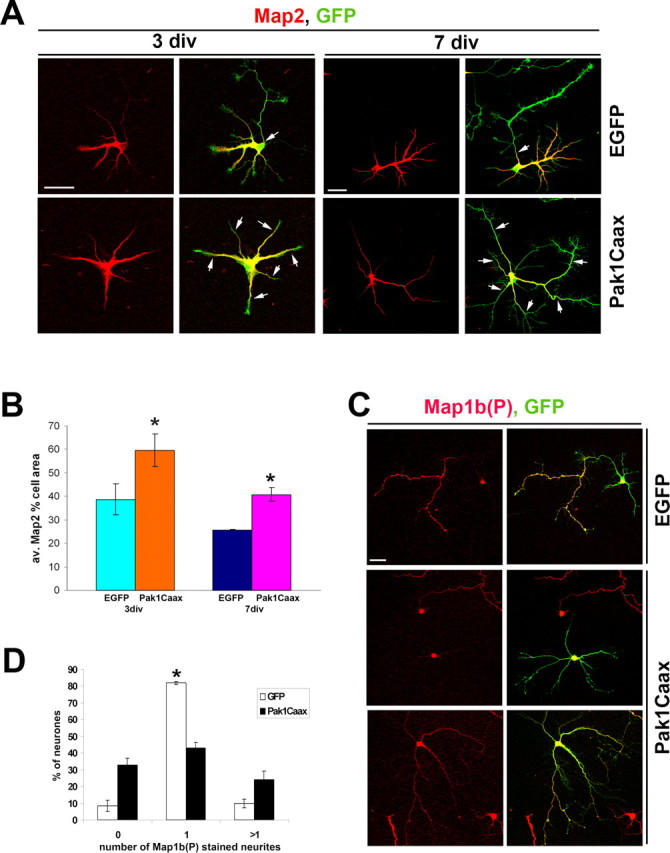
Pak1 hyperactivation affects the distribution of microtubule-associated proteins. A, Pak1Caax-expressing neurons have a broader distribution of Map2 at 3 and 7 div than EGFP controls. Arrows mark the extent of Map2 presence in individual neurites. B, The average (av.) percentage of a cell area that contains Map2 is greater after Pak1Caax expression than in EGFP controls. C, Two representative examples show Pak1Caax-induced absence of Map1b(P) or widespread distribution of Map1b(P) in all neurites. D, Neurons were scored for the absence of Map1b(P) or its presence in one or multiple neurites. Scale bars, 50 μm. Error bars represent SEM. *p < 0.001 using Student's t test.