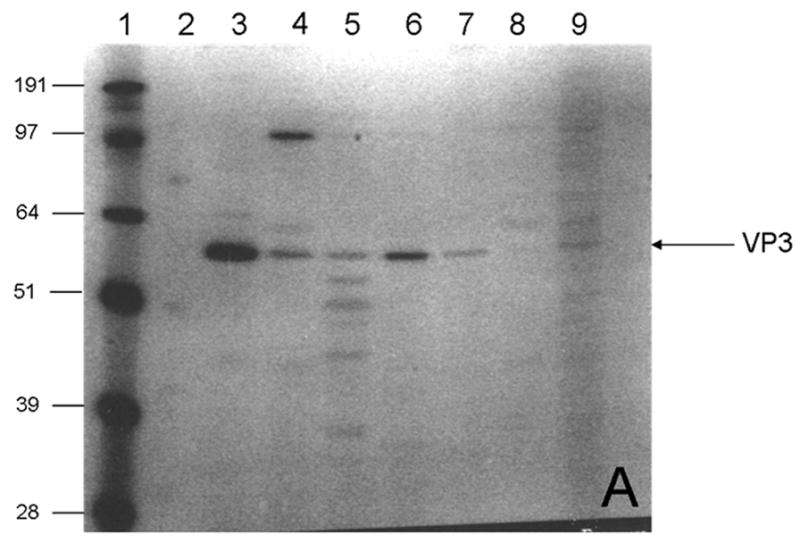
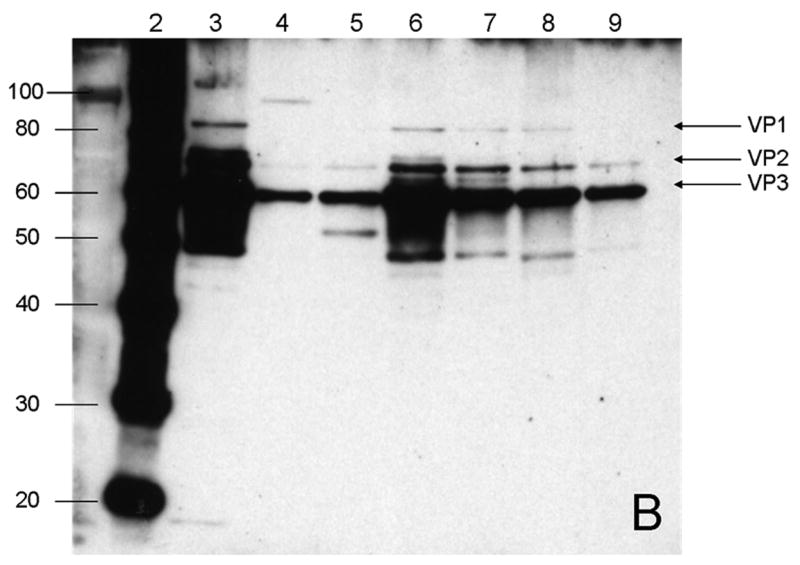
Fig. 1.


Distribution of rAAV capsid proteins (VP1, VP2 and VP3) analyzed by A) SDS-PAGE; and B) Western Blot. Only fractions with a density close to 1.41 g/cm3 of the CsCl gradient at 72hpi from each bioreactor configuration were analyzed. Lane 1) Low molecular weight marker; 2) Western blot marker. Densities in g/cm3 of the CsCl fractions for 3) 200ml, 1.4075; 4) 5L Wave, 1.4307; 5) 20 L Wave, 1.4128; 6) 10 L STB, 1.4180; 7) 40 L STB1, 1.4328; 8) 40L STB 2, 1.4159 and 9) 40L STB 3, 1.4117.
