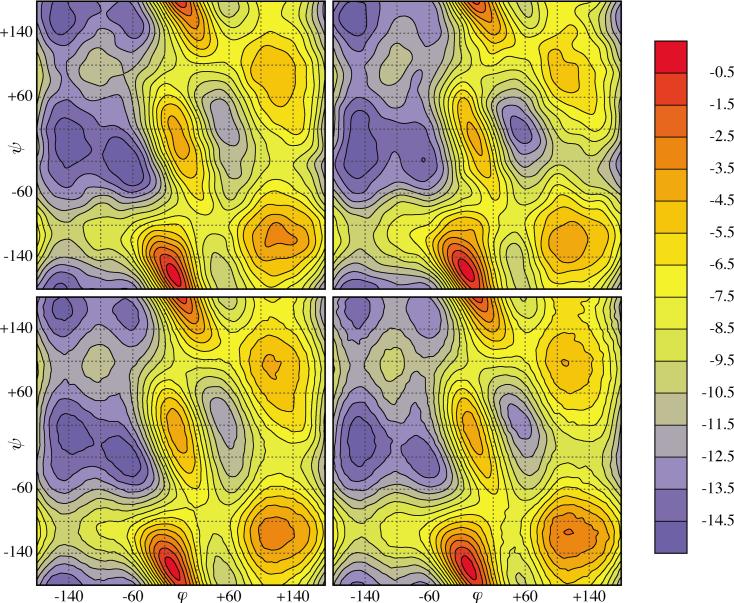
FIG. 11.
(Color) Free energies for zwitterionic trialanine (Fig. 2): as computed by metadynamics alone (top row), including umbrella corrections (bottom row). Left column: implicit solvent and right column: explicit solvent. In each case the free energy has been sampled on a 60×60 grid [bicubic interpolation (Ref. 44) used]. The color changes from blue through yellow to red as the value of the free energy increases. The contour lines are plotted at −14.5, −13.5, . . . ,−0.5 kcal/mol.

