
Figure 3.
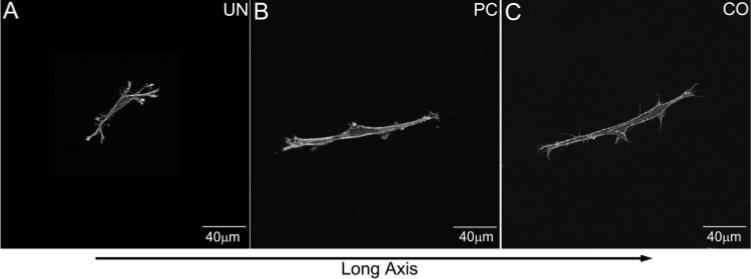
Maximum intensity projections demonstrating typical cell morphologies within the A-zone of the three models (UN, PC, CO). The long axis of the construct is horizontal. Note the numerous branching cell processes within the UN model; cells within the PC and CO models are bipolar.