
Figure 4.
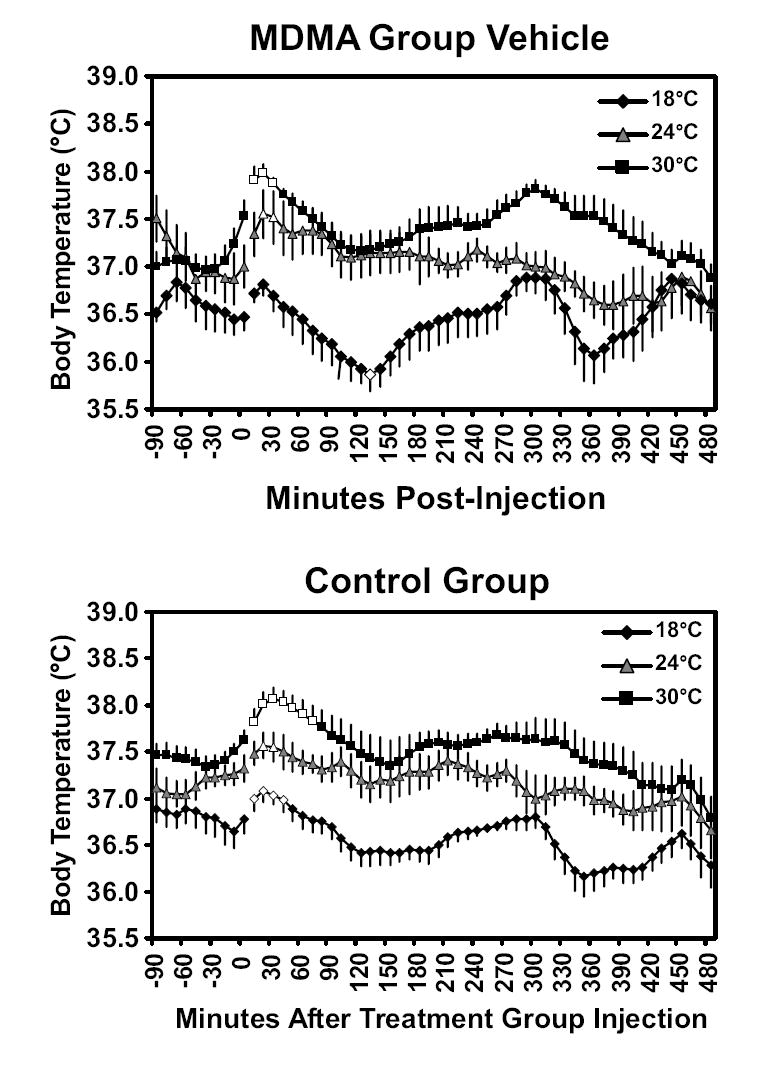
The mean subcutaneous temperature values following vehicle injection under three ambient temperature conditions for the experimental group (N=6, bars indicate SEM) are presented in the top panel. A significant difference from the timepoint preceding injection is indicated by the open symbols The lower panel presents mean (N=4, bars indicate SEM) subcutaneous temperature under each ambient temperature for an untreated control group. The control group’s data reflect grand averages of individual data averaged across four sessions for each ambient condition. These data are represented relative to the time of injection of the treatment group within the same housing room.