
Figure 8.
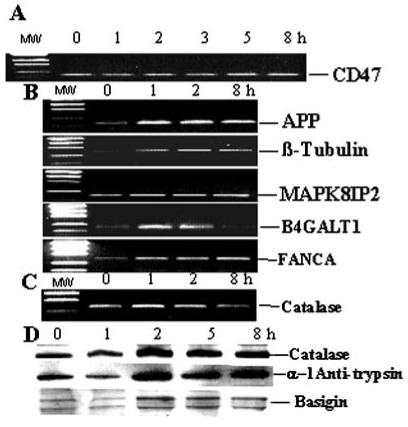
Data validation of a selected group of genes at the transcript and protein levels. (A) Semiquantitative RT-PCR analysis of CD47 transcript levels used as a control for the unchanged gene. (B) Semiquantitative RT-PCR analysis of transcript levels of amyloid βA4 precursor protein (APP, group 8), β-tubulin (TUBB, group 3), Jun NH2-terminal kinase (JNK) interacting protein 2 (MAPK8IP2, groups 2 and 9), UDP-galactose:β-N-acetylglucosamine β-1,4-galactosyltransferase 1 (B4GALT1, group 3), and Fanconi anemia complementation group A (FANCA, group 1). The primers, sizes of products, and annealing temperatures are given in Table 1. Functional groups are listed in Figure 7. (C) Semiquantitative RT-PCR analysis of catalase (group 2) transcript levels. On left, DNA ladders are shown in (A), (B), and (C). (D) Western blot analysis of catalase (group 2), α-1-antitrypsin (group 8), and basigin (group 3).