
Figure 1.
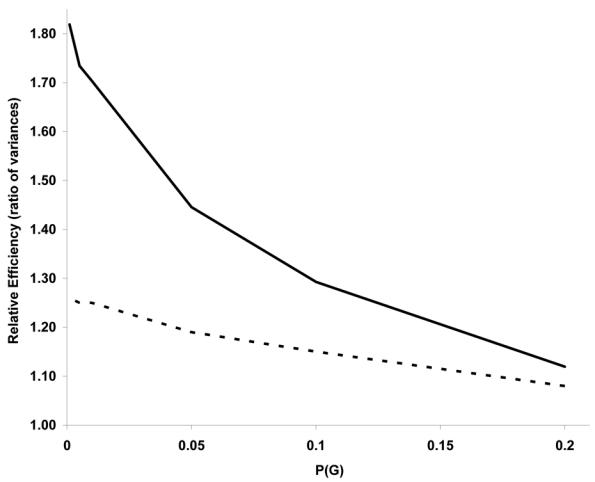
Relative efficiency from unconditional analysis, RE(U) (bold-line) and from conditional analysis RE(C) (dashed-line) according to the frequency of G for a dominant gene with RG=3, RE=2, RI =5, P(E)=0.2, and F=0.5.
Official websites use .gov
A
.gov website belongs to an official
government organization in the United States.
Secure .gov websites use HTTPS
A lock (
) or https:// means you've safely
connected to the .gov website. Share sensitive
information only on official, secure websites.
Relative efficiency from unconditional analysis, RE(U) (bold-line) and from conditional analysis RE(C) (dashed-line) according to the frequency of G for a dominant gene with RG=3, RE=2, RI =5, P(E)=0.2, and F=0.5.