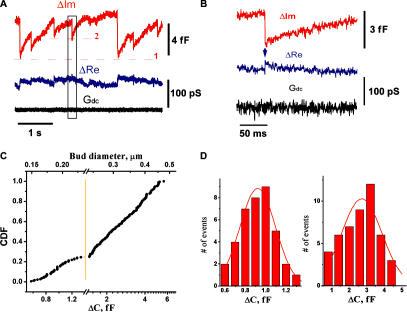
Figure 1.
Interaction of M protein with lipid membrane, monitored by patch clamp admittance measurements. (A) Changes of the admittance (ΔIm and ΔRe) and ionic permeability (Gdc) of the patch connected to the membrane reservoir upon application of 2 μM of M protein. Level 1 shows the background level of ΔIm corresponding to the initial area of the patch. ΔIm deviations back and forth to level 1 indicate reversible changes of the patch area, and each single alteration (e.g., around level 2) indicates a budding event. (B) Expanded selection from black box in A. Transient increase in ΔRe (arrow) indicates formation of a thin membrane neck. (C) Cumulative distribution of the values of ΔIm jumps and the corresponding diameters of the spherical membrane particle. The initial part of the distribution (up to ∼1.3 fF) is expanded to show a Gaussian-like profile. (D) Left histogram shows the distribution of small ΔIm jumps from C; right histogram shows the distribution of ΔIm jumps obtained at elevated (5 μM) concentration of M protein.

