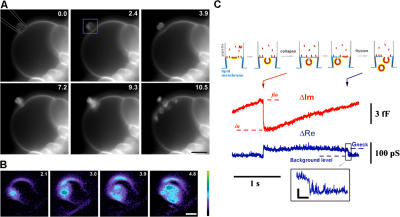
Figure 2.
Visualization of the budding activity of M protein on a membrane patch. (A) Frame sequence (time in seconds) illustrating budding from a patch pipette (approximately drawn in the first image) containing 2 μM of M protein observed on a GUV. A small part of the large GUV, attached to a platinum electrode used for electroformation, was sucked into the pipette. Recording began after establishing a stable contact between the GUV and the pipette. Bar, 5 μm. (B) Expanded images, corresponding to the area marked by the purple rectangle in A, illustrate brightening of the membrane patch upon M protein adsorption. (C) The scheme outlines a correspondence between the changes in ΔIm and the budding. Levels in and fin show the ΔIm increase caused by formation of a bud. Red arrow indicates bud closure; blue arrow indicates fission of the neck. (inset) The fission shown in detail. Bars: (A) 5 μm; (B) 1 μm; (C, horizontal) 40 ms; (C, vertical) 20 pS.

