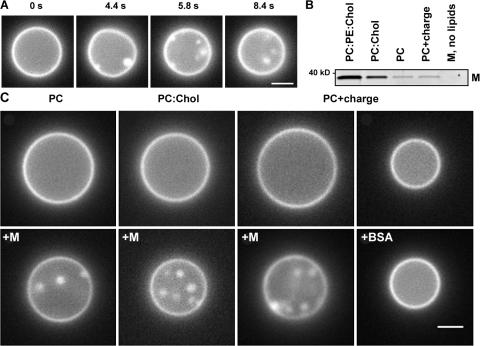
Figure 3.
Formation of intralumenal vesicles by M protein applied to GUVs of different lipid compositions. (A) Frame sequence shows formation of intralumenal vesicles after M protein application (at 0 s) to GUV (PC–cholesterol mixture). (B) M protein adsorption on LUVs of different lipid compositions (0.005 protein/lipid ratio) measured by gradient flotation technique. The same protein concentration for all bands was loaded and the control fraction (M, no lipids) was taken at the same level as the liposome fraction. (C) Effect of M protein and BSA application (4 μM in the delivery pipette) on the morphology of GUV of different lipid compositions. Images were taken before (top) and ∼2 min after (bottom) protein application. Representative images of three independent experiments are shown. Bars, 2 μm.

