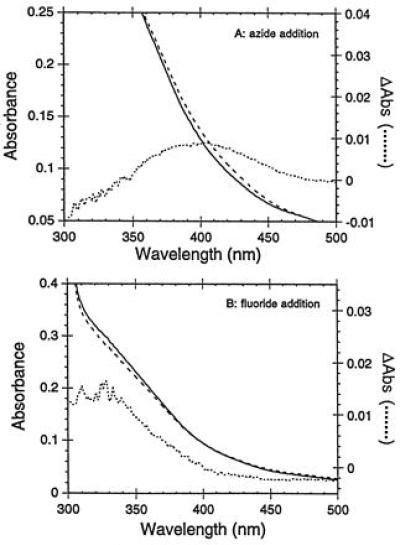
Figure 4.

Anion binding. The UV/vis spectrum of {Fe3+}Trx-SOD (1.1 × 10⁻⁴ M) in 20 mM Hepes (pH 8.0)/25 mM NaCl at 21°C (solid line) was recorded. The sample was then adjusted to 100 mM sodium azide (A, broken line) or 100 mM sodium fluoride (B, broken line). Dotted lines represent difference spectra in A and B.
