
Fig. 4.
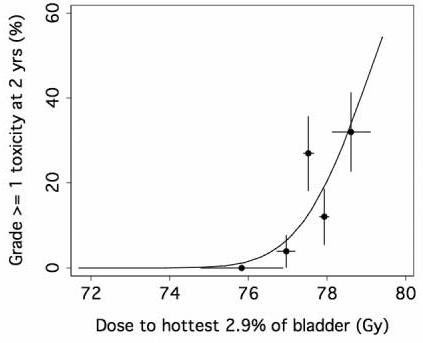
Fit of absolute hottest volume (hot-spot) models to the late GU toxicity data. The points represent the incidence of toxicity in each of 5 equal subgroups of patients (25-26 patients each), plotted at the mean value of dose to hottest 2.9% volume in the subgroup. The horizontal error bars represent ± 1 standard deviation of the mean in each group, and the vertical error bars represent ± 1 standard deviation calculated from the observed incidence of complications, assuming binomial statistics.