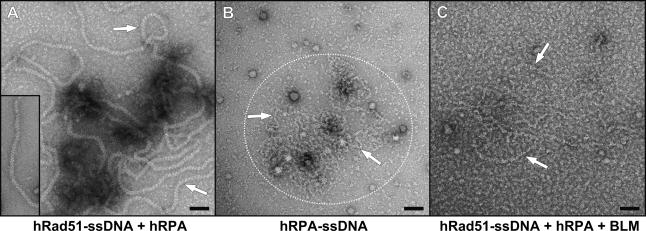
Figure 3.
Analysis of hRad51-ssDNA filament disruption by BLM using electron microscopy. (A) The hRad51-ssDNA filament (indicated by arrows) was formed and then mixed with hRPA. hRad51-ssDNA filament formed in the absence of hRPA is shown in the bottom left corner. (B) hRPA–ssDNA complexes (in the encircled area) are indicated by arrows. (C) The hRad51-ssDNA filament was formed and then mixed with BLM and hRPA. The reaction resulted in disruption of the filament and formation of hRPA–ssDNA complexes (indicated by arrows). Bar, 50 nm.

