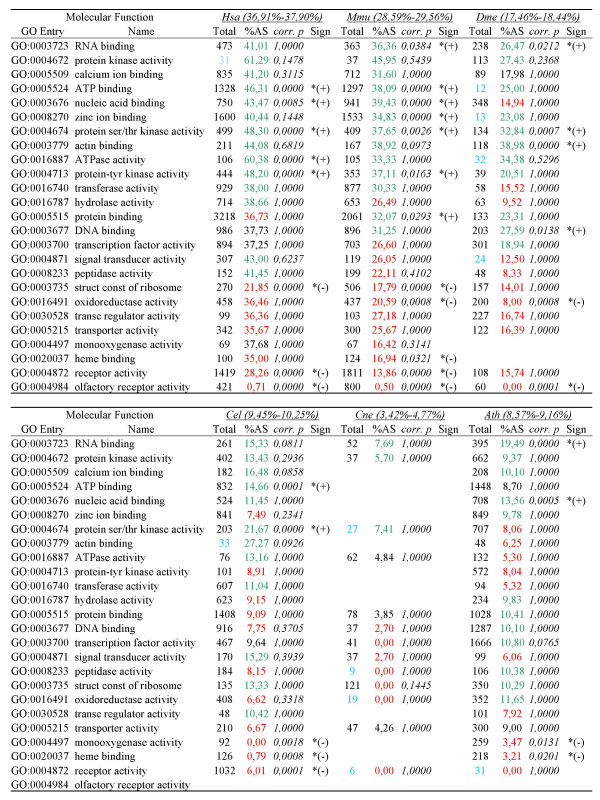
Figure 5.
AS frequency for GO categories for molecular function. For each category, green/red colored AS frequency indicates that the frequency is higher/lower than the average, with (*) denoting statistical significance. In the "Total" column, the total number of genes of each category is shown (categories represented by less than 35 genes are shown in blue). In parenthesis, for each species, 95% confidence interval for the average of alternatively spliced genes in all Molecular Function categories. p-values are given after multiple testing correction. Abbreviations: Hsa (H. sapiens), Mmu (M. musculus), Dme (D. melanogaster), Cel (C. elegans), Cne (C. neoformans), Ath (A. thaliana).

