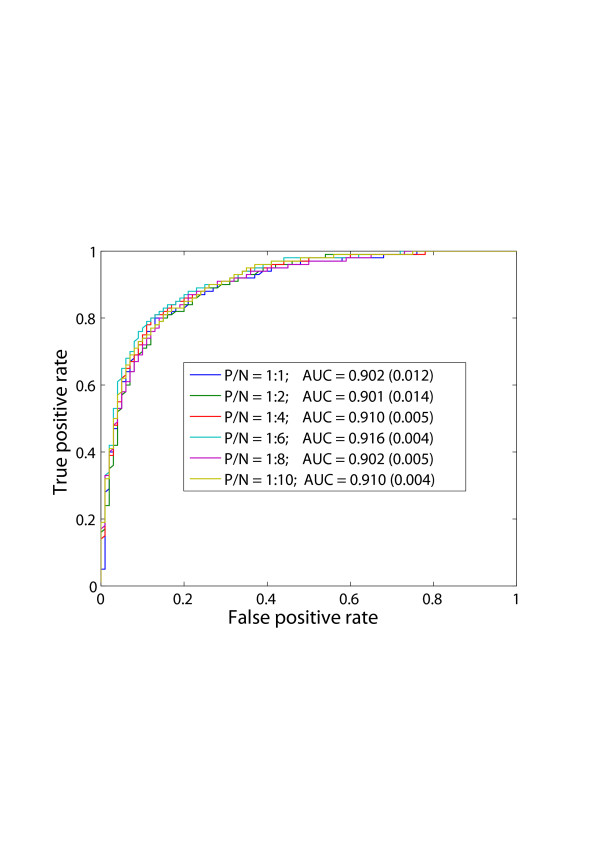
Figure 1.
ROC curves of training set (1) – (6) by RBF-SVM using 10-fold cross-validation. P and N indicate positive and negative, respectively. AUC means the area under the curve. The larger the AUC is, the better the performance of the model will be. The real numbers in brackets are standard deviation (std).

