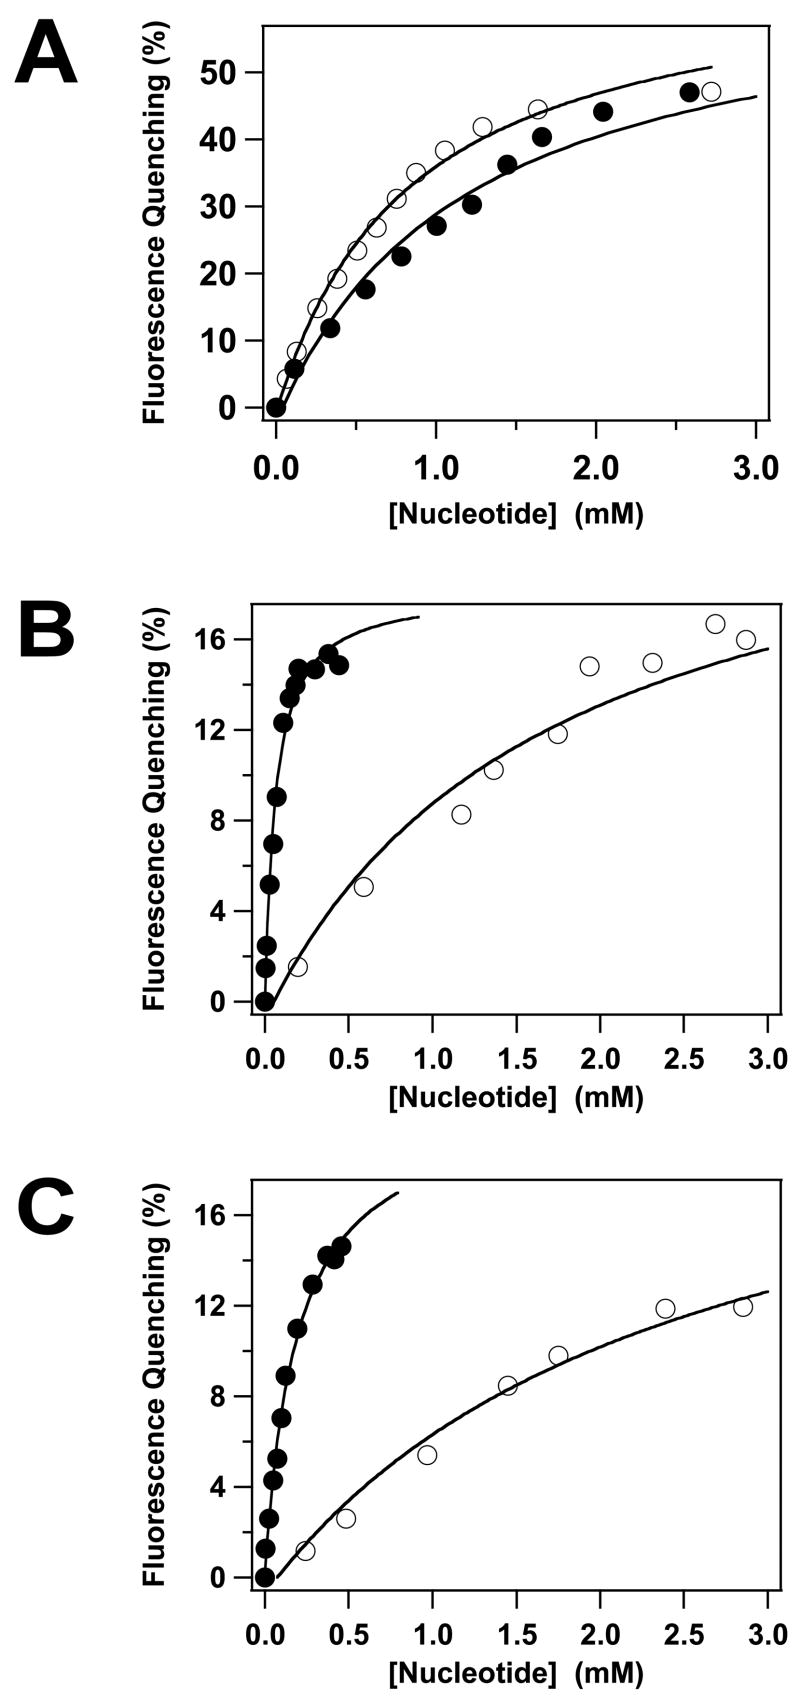
Figure 3.
Fluorescence-Monitored Nucleotide Binding to the gpA Deletion Constructs. ATP (○) or ADP (●) was incrementally added to gpA-FL (Panel A), gpA-ΔN179 (Panel B) or gpA-ΔN179,K497D (Panel C) and the intrinsic fluorescence of the proteins recorded as described in Materials and Methods. Each data point represents the average of at least three separate experiments (standard deviation 2%-3%, omitted for clarity). The solid lines represent the best fits of the data to a simple Langmuir binding model.

